Glossary
If you can't find what you're looking for please contact us.
A number of Bodystat Parameters are listed below with explanations to assist you with any queries.
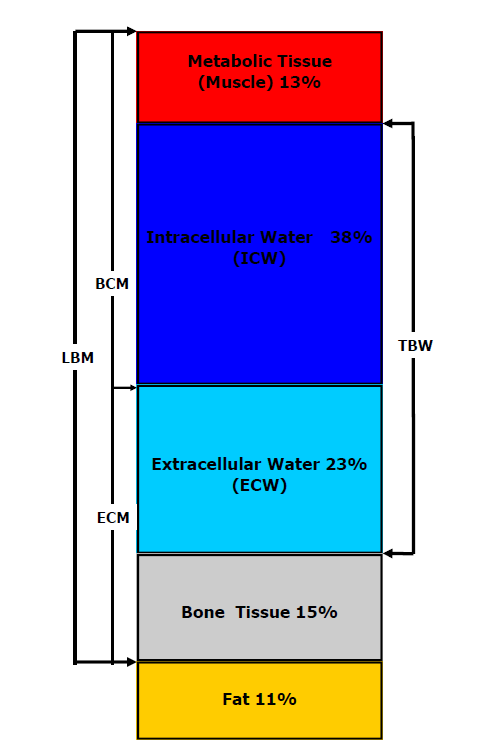
Mass and Water Distribution
The Figure below provides a graphical representation of the relationship of mass and water distribution.
Total Body Fat (Fat)
All bodies contain fat. It is located largely under the skin, but its presence is distributed throughout other tissues and in cell membranes. It is essential for life that we contain a minimal proportion of body fat. Most people, however, have large amounts of fat acting as stores of energy.
Typical fat: women (30 years old) 20-25% of body weight. Men (30 years old) 15-20% of body weight.
Fat Free Mass (FFM) or Lean Body Mass
FFM and Lean Body Mass (LBM) are often used interchangeably and are quite close in some definitions, but they are not always equivalent depending on how they are derived. FFM represents all the gross chemical composition of the body apart from organic solvents soluble and extractable lipids (fat). It includes all water, protein and mineral and miscellaneous others such as urea, RNA, DNA, glycogen etc, i.e. it is a chemical definition. Nowadays most authorities use this term because it is a firmer definition. It is the sum of BCM and ECW and consists of muscle, bone, minerals and other non-fat tissue.
Dehydration
Refers to losses of intracellular water that ultimately causes cellular desiccation (drying up) with resulting elevated plasma sodium concentrations and osmolality.
Total Body Water
The total amount of fluid in the body whether in cells, outside cells, in blood etc. Since most of the body water is contained in the Lean Body Mass, the body water percentage will increase with a loss of fat weight and a gain in lean tissue.
Typical values: Women 50-60% of body weight. Men 55-65% of body weight.
These values vary with hydration state, pregnancy, menstrual phase, aging etc.
Extracellular Fluid
The non-metabolising fluid surrounding cells that provide a medium for gas exchange, transfer of nutrients and excretion of metabolic end products. It is ~ 94% water by volume, is distributed into 2 main compartments: plasma in the intravascular space and interstitial fluid in the extravascular space.
Intra and Extracellular Water (ICW, ECW)
Those components of total body water located within cells (ICW) and outside cells (ECW).
Dry Lean Weight
The dry lean weight is the Lean Weight excluding water (muscle and bone).
Basal Metabolic Rate (BMR)
Rate the body burns energy (in calories) during a normal resting state, over a 24-hour period to maintain essential body elements e.g. body temperature, heartbeat, brain, lungs. This is the minimum amount of energy required to keep a person alive. BMR is based upon an individual’s Fat Free Mass. The greater the BMR per kg of Body Mass, the faster the body will consume excess calories. Regular exercise may assist in increasing BMR.
Estimated Average (Energy) Requirement (E.A.R.)
The estimated amount of energy a body requires during a 24hour our period to maintain its present body composition status for a required activity level.
Body Mass Index
The BMI is a simply determined and widely used measure of body status. It is largely independent of underlying body frame size.
BMI (kg/m2)= [body weight (kg)] / [body height (m)]2
Reference ranges:
Underweight <20
Normal weight 20-25
Overweight 25-30
Obese >30
Body Fat Mass Index (BFMI)
Body Fat Mass Index is similar to BMI except that it looks at the volume of fat in the body in relation height squared.
Fat-Free Mass Index (FFMI)
Fat-Free Mass Index is similar to BMI except that it looks at the volume of Lean Weight in the body in relation height squared.
Body Cell Mass
The total mass of cells in the body comprising the metabolically active tissue. It is a component of LBM or FFM.
Nutrition Index
The ratio between Extracellular Water and Total Body Water. The measurement of TBW is of limited value in the nutritional assessment of some seriously ill patients. Patients with trauma or sepsis may retain fluid in response to nutritional support and weight gain may simply reflect an expansion of the extracellular water space. Such weight gain cannot be considered as an improvement in nutritional status as it does not reflect an increase in protein stores. A more useful assessment of nutritional status in these patients may be obtained from separate estimates of ECW and TBW.
Waist to Hip Ratio
The waist to hip circumference is an indication of the distribution of body fat. Where waist circumference equals or exceeds the hip circumference, there is growing evidence to show that the risk of chronic heart disease increases significantly.
High risk ratio for males 1.00 and higher
High risk ratio for females 0.80 and higher
Prediction or Wellness Marker
The Prediction Marker or Impedance Ratio is the ratio between the impedance measurement at 200 kHz and 5 kHz. The Wellness Marker is the Impedance ratio between the impedance measurement at 50 kHz and 5 kHz. The objective of Bodystat’s unique Prediction or Wellness MarkerTM is to provide health professionals with a tool for early detection of cellular change before it becomes clinically obvious. By combining the information obtained from the measurement of body fat, fat-free mass and the Prediction or Wellness Marker, even malnourished obese subjects may be identified. There is always a danger that high levels of body fat may obscure an underlying serious illness developing, such as cancer or other wasting diseases. By monitoring an individual’s unique Prediction or Wellness Marker it may be possible to detect the advent of a potentially serious medical condition. Healthy individuals with good cellular status tend to have a lower Prediction or Wellness Marker while the unhealthy have higher values. The lower the marker, the healthier and more hydrated the body cells; the higher the marker, the less healthy. Bodystat’s unique Prediction and Wellness Marker is specifically designed to quickly and non-invasively assess overall cellular health status and the earliest signs of cellular malfunction.
Impedance
Impedance is the pure opposition to the flow of an alternating current produced by the capacitant effect of cell membranes and tissue interfaces. Since the fat-free or lean tissues have a high proportion of water and electrolytes they are a good current conductor, whilst the fat mass has a high resistance and is essentially non-conductive.
Reactance
Reactance results from the additional opposition to the flow of an alternating current due to the capacitive nature of cell membranes.
Resistance
Resistance is the pure opposition to the flow of an alternating current produced by the capacitant effect of cell membranes and tissue interfaces. Since the fat-free or lean tissues have a high proportion of water and electrolytes they are a good current conductor, whilst the fat mass has a high resistance and is essentially non-conductive. Resistance is inversely proportional to body water and fat-free tissue mass. Since measured resistance is also dependent upon the cross-sectional area of the conductor, biological resistance is dominated by that of the extremities i.e. the limbs.
Impedance/Resistance/Reactance/Phase Angle Relationship
Biophysically, the human body represents a network of resistors and capacitors with the extracellular and intracellular fluids acting as resistors and the cell membrane as a capacitor. The Impedance (Z) is composed of two vectors, Resistance (R) and Reactance (Xc). The angle between these two vectors is called phase angle, which is dependent on the number of cells, cell size, membrane permeability, and the distribution of body fluids. At high frequencies Xc is a relatively small component and the impedance is numerically close to the resistance; the two values are identical at infinite frequency.
Phase Angle
Phase Angle is a measurement at 50 kHz relating to the function & integrity of the cell membrane and thus overall cellular health.
Phase Angle is made up of two components: resistance (fluid) and reactance (body cell mass). The higher the Phase Angle the healthier the cells. The Phase Angle records the voltage drop in an applied current. The voltage drop is larger if the reactance (ie the ability of the cell to react with the current) is larger which only occurs in a healthy functioning cell membrane.
The expression for the phase angle φ is:
φ = arctg X/R, where resistance is R and reactance is X.
Phase Angle has been found as a useful prognostic indicator of ill health such as malnutrition, cancer and other potentially serious diseases.
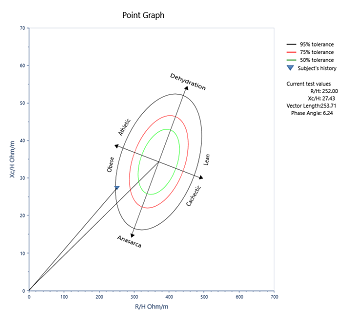
BIVA (Bioelectrical Impedance Vector Analysis)
BIVA is a method of interpreting the data obtained from some Bioelectrical Impedance Analysis devices. It is a quick, simple, pictorial way of discovering the hydration and nutritional status of the subject in comparison to their population group. It establishes where your client is in reference to their demographic.
BIVA stands for Bioelectrical Impedance Vector Analysis and is sometimes referred to as the ‘RXc graph’. It simply uses the Resistance (R) and Reactance (Xc) at 50kHz and is normalised to the subject’s height (not requiring the subject’s weight). Once the measurement is performed, the subject’s results are illustrated in the form of a dot on the vector. The position of the dot then reflects the subject’s health status (lean mass and hydration) in comparison to the subject’s chosen demographic group.
Graphical Representation
The subject in the graph is illustrated by a dot. The desired outcome for a physician is a dot within the 75% tolerance of the statistic distribution of the chosen demographic group.
The vector line indicates the Vector Length. The shorter this line the more fluid overload or oedema is present and the longer the line illustrates dehydration.
Consideration is then given to the angle of the vector. The steeper the angle the more athletic or obese the subject is, whereas a shallow angle reflects malnourishment or anorexia.